

 US
 CA
 GB
 AU
 NZ
A health system can have an impressive analytics environment and still struggle to answer a basic question: given what we know today, what should we do differently tomorrow?
Health systems collect information across clinical records, operational systems, quality programmes and financial platforms. Dashboards bring these sources into view, helping people understand performance across the organisation. The challenge is converting that visibility into decisions that improve care and make better use of constrained resources.
What makes a healthcare dashboard effective?
Research suggests that dashboard design remains an unfinished discipline. In a 2026 scoping review, Vornhagen and colleagues examined 18 studies on healthcare dashboard design. Only four described comprehensive design guidelines. User involvement and workflow integration were recurring themes, while governance and long-term adoption received limited attention.
A separate umbrella review by Almasi and colleagues brought together evidence from 41 reviews. It identified benefits for decision-making and adherence to evidence-based practice, alongside persistent challenges with data quality and user engagement.
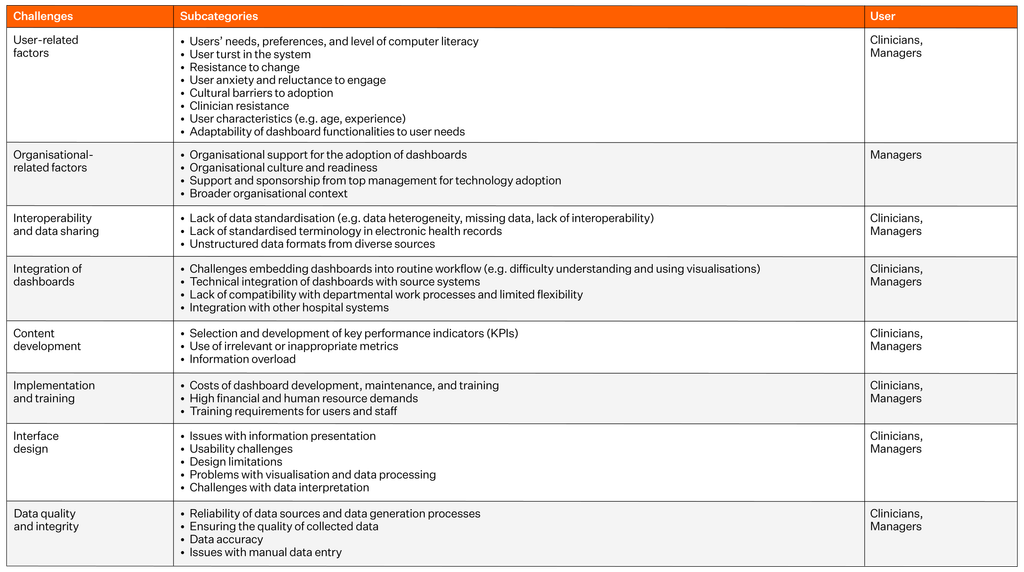
Almasi, S., Rabiei, R., Hamedi, S. Z., Ghaderzadeh, M., & Bastani, P. 2026). Umbrella review of healthcare dashboards: Applications, benefits, design, and challenges. Digital Health, 12, 20552076261429609.
A dashboard’s usefulness therefore depends on the quality of the underlying data and the conditions under which people use it. An operational indicator may be accurate but lack the context needed to explain worsening performance. A financial metric may reveal an opportunity to reduce expenditure while obscuring a consequence for clinical quality.
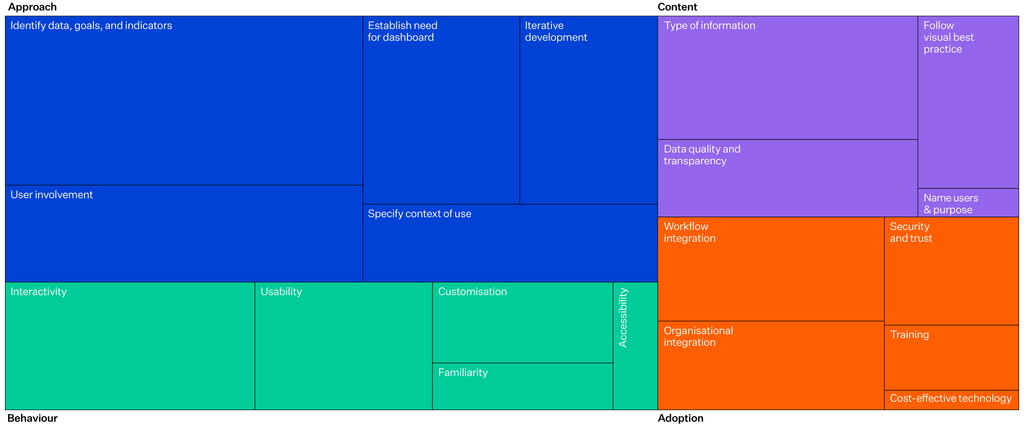
What matters when designing a dashboard
Vornhagen, H., Barrett, S., Carroll, C., Iladiva, L. K., Martin, G., McKeown, D., & Martin, J. (2026). Design practices for data
dashboards in health care: scoping review. Journal of Medical Internet Research, 28, e77361.
How should healthcare dashboard success be measured?
In their framework for evaluating healthcare dashboards, Zhuang, Concannon and Manley reinforce an important distinction: a dashboard can function as designed while its wider organisational impact remains uncertain.
The number of dashboards deployed, metrics displayed and user logins can describe adoption. They cannot, by themselves, establish organisational value.
For example, a dashboard may show an increase in a complication rate. The next steps involve validating the signal, agreeing an appropriate response and assessing whether the intervention improved care.
Dashboard success should therefore be evaluated across the decision process, from the initial signal through to the action taken and the resulting outcome.
From accurate data to better healthcare outcomes
Daniel Belisle’s framework for perioperative care describes four levels of data proficiency.
Accurate data establishes the foundation for credible measurement. Trend analysis helps leaders understand how performance changes over time. Predictive analysis supports anticipation of future demand. The final level involves using evidence to influence what happens in practice.

Belisle, D. (2025). The Four Levels of Data Maturity in Healthcare: A Framework for Driving Outcomes in Perioperative Care.
Perioperative Care and Operating Room Management, 100600.
Consider operating theatre utilisation. A health system may begin by consistently recording scheduled and actual theatre times. It can then identify recurring delays and compare performance across services. Forecasting may help anticipate demand and workforce requirements. Ultimately, leaders can use this information to adjust schedules or improve referral coordination.
The value emerges when those decisions improve throughput, support better use of capacity or create room for additional activity without compromising care.
How to build a business case for healthcare dashboards
A stronger investment case connects analytics to a defined decision, identifies the expected clinical or operational outcome and establishes how the result will be measured.
The evidence offers grounds for investment, with some caution. Coiera and colleagues’ 2025 systematic review included 70 studies examining the clinical and economic impact of hospital dashboards. Of 43 findings reporting length of stay, 28 reported a reduction. Of 34 findings reporting economic impacts, 29 reported reduced costs. Mortality findings were more mixed, with most showing no statistically significant change.
However, variation in study design and quality makes it difficult to isolate the dashboard’s contribution from other organisational changes.
A reduction in length of stay may create capacity, but the financial benefit depends on how the organisation uses it. Reduced expenditure, increased throughput and improved access are different forms of value, each requiring its own assessment.
The business case should explain how the expected benefit will be realised and account for implementation, data engineering, integration, clinical engagement and ongoing maintenance.
Make responsibility clear
A capacity problem may involve clinical leaders, operations, workforce planning and finance. A deterioration in quality may require changes to clinical practice, additional training or a review of available resources.
Dashboard design must accommodate these relationships. Measures need agreed definitions and appropriate clinical context. People receiving the information must understand what it means and have a practical route to initiate action.
Governance should establish who is responsible for reviewing a signal and when the resulting outcome will be assessed. Wherever possible, these arrangements should sit within existing clinical and operational routines. Randell and colleagues’ research on NHS quality dashboards also highlights the importance of choosing relevant indicators.
For technology suppliers, this means designing implementation around the decisions the organisation needs to make. Workflow integration and the ability to investigate a signal are central to making analytics useful.
Ask which decisions will change.
A health system’s analytical maturity is reflected in how well it uses evidence to direct attention and resources towards better outcomes.
The strategic question is straightforward: which decisions would we make differently if our data were working as effectively as we expect?
Authored by Tom Varghese, Global Product Marketing & Growth Manager at Orion Health.
Resources
Almasi S, Rabiei R, Hamedi SZ, Ghaderzadeh M, Bastani P. Umbrella review of healthcare dashboards: applications, benefits, design, and challenges. Digital Health. 2026;12:1–17.
Belisle D. The four levels of data maturity in healthcare: a framework for driving outcomes in perioperative care. Perioper Care Oper Room Manag. 2026;42:100600.
Coiera E, Chan A, Brooke Cowden K, Rahimi Ardabili H, Halim N, Tufanaru C. Clinical and economic impact of digital dashboards on hospital inpatient care: a systematic review. JAMIA Open. 2025;8(4):ooaf078.
Randell R, Alvarado N, McVey L, Ruddle RA, Doherty P, Gale C, Mamas M, Dowding D. Requirements for a quality dashboard: lessons from national clinical audits. AMIA Annu Symp Proc. 2019;2019:735–744.
Vornhagen H, Barrett S, Carroll C, Iladiva LK, Martin G, McKeown D, Martin J. Design practices for data dashboards in health care: scoping review. J Med Internet Res. 2026;28:e77361.
Zhuang M, Concannon D, Manley E. A framework for evaluating dashboards in healthcare. IEEE Trans Vis Comput Graph. 2022;28(4):1715–1731.